
IELTS Writing Tips
Mastering IELTS Writing Task 1
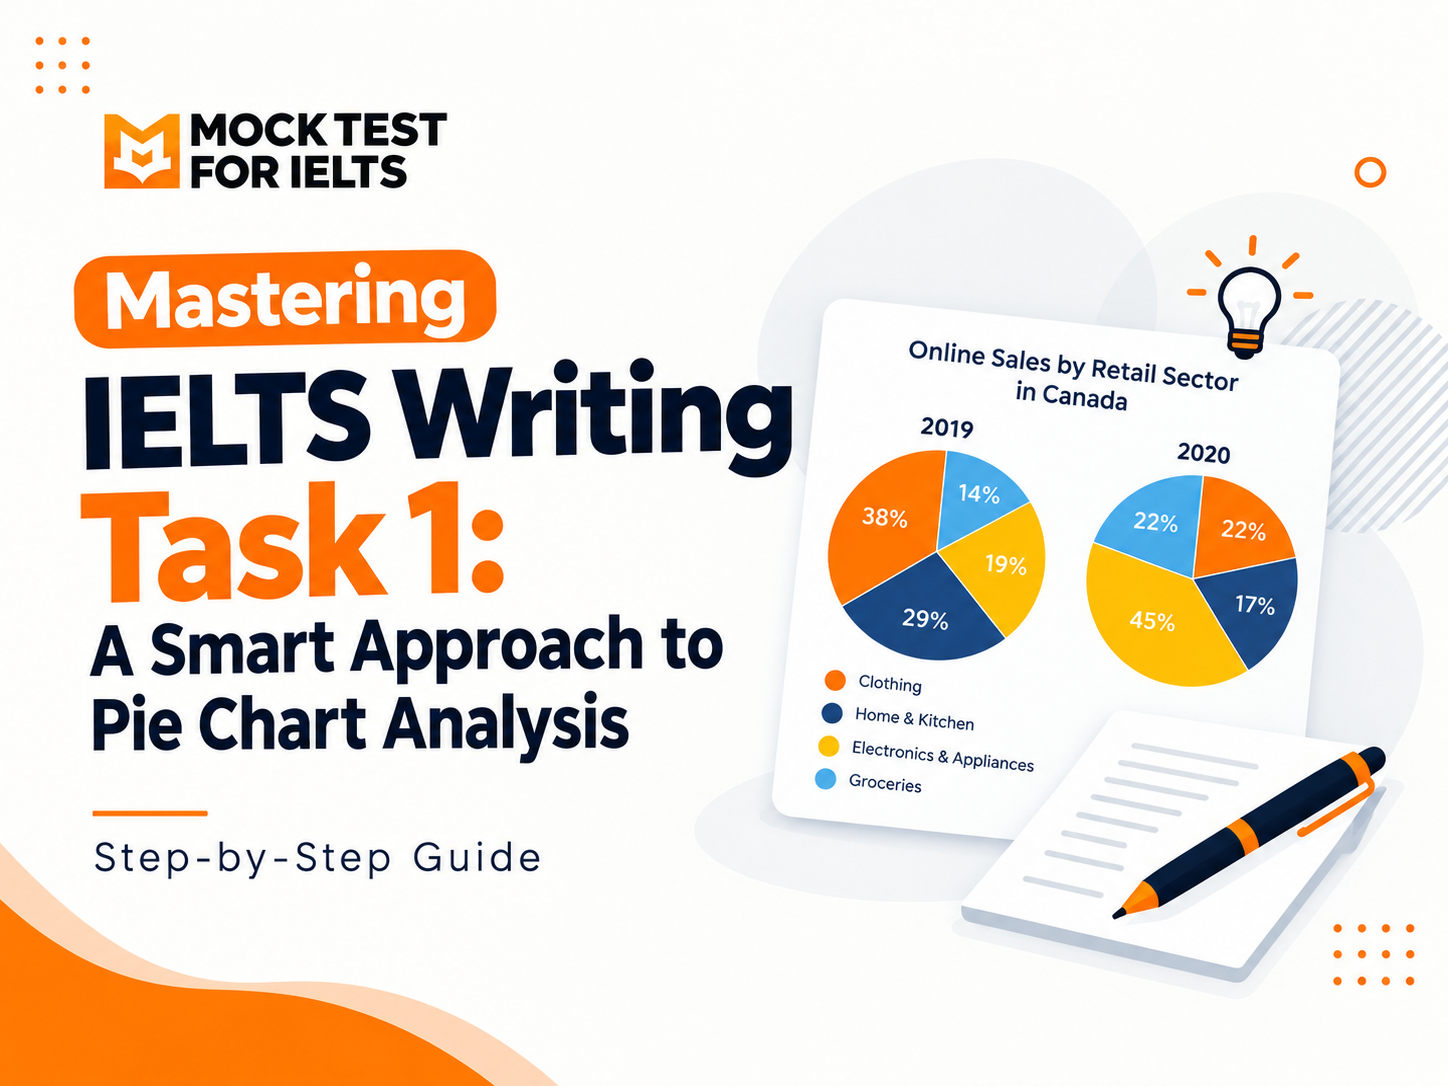
Mastering IELTS Writing Task 1: A Smart Approach to Pie Chart Analysis
Analyzing a pie chart in IELTS Writing Task 1 can seem daunting, but with a structured, step-by-step approach, you can easily secure a high band score. In this guide, we break down how to write a high-scoring response using a real IELTS exam question.
This blog post is designed for MockTestForIELTS to help students master the "SMART" writing method.
The Exam Prompt
> The pie charts compare the online sales for retail sectors in Canada in the years 2019 and 2020. > > Summarise the information by selecting and reporting the main features, and make comparisons where relevant.
5 Steps to a High Band Score
A smart and organised response follows a clear 5-step structure:
- Step 1: Introduction (Paraphrasing the Prompt)
- Step 2: Overview (Highlighting Key Trends)
- Step 3 & 4: Body Paragraphs (Detailed Data Comparison)
- Step 5: Conclusion / Summary of General Trends
Let's look at each step in detail using the Canadian online sales data.
Step 1: Paraphrasing the Prompt (The Introduction)
To get a high band score, you must avoid copying the prompt word-for-word. Instead, paraphrase the key terms.
Vocabulary Switches
| Original Prompt Term | Smart Paraphrase / Synonym |
|---|---|
| Online sales | Internet sales / Proportion of internet sales |
| Retail sectors | Market segments |
| Electronics and appliances | Electrical items / Electrical appliances |
| Home and kitchen | Household items / Household goods / Home furnishings |
| Clothing | Clothing sector |
Example Introduction Paragraph
> The charts compare four market segments, which are electronics and appliances, groceries, home and kitchen, and clothing, in terms of the proportion of their internet sales in Canada over two years (2019 and 2020).
Step 2: Writing the Overview
Your overview must focus on the key features that stand out immediately, such as maximum/minimum values or major changes, without including specific percentages.
For this dataset, the two main trends are:
- Growth: The figures for groceries and electrical appliances increased.
- Decline: The figures for home and kitchen and clothing decreased.
Example Overview Paragraph
> Overall, the proportion of online sales for each of the four sectors changed significantly over the two-year period. While the figures for groceries and electrical appliances increased, the percentages for the other two sectors experienced a decline.
Steps 3 & 4: Body Paragraphs (Reporting the Data)
In the body paragraphs, you must support your claims with precise numbers and make direct comparisons.
Body Paragraph 1: The Rising Sectors (Groceries & Electronics)
Groceries
- Started at 14% in 2019.
- Increased to 22% in 2020.
Electronics & Appliances
- Increased significantly from 19% in 2019.
- Rose to 45% in 2020.
Example Paragraph
> In 2019, the proportion of online sales of groceries was 14 percent, but this rose to 22 percent in 2020. Similarly, the percentage for internet sales of electronics went up significantly from 19 percent in 2019 to 45 percent in 2020.
Body Paragraph 2: The Falling Sectors (Clothing & Home/Kitchen)
Home & Kitchen
- Accounted for 29% of online sales in 2019.
- Experienced a decrease in 2020.
Clothing
- Fell significantly from 38% in 2019.
- Dropped to 22% in 2020.
Example Paragraph
> In contrast, the percentages of the online sales of the other sectors decreased over the two years. While home and kitchen accounted for 29 percent of the total online sales of these four sectors in 2019, it fell in the following year. There was also a notable decrease in the clothing sector, which saw a fall from 38 percent in 2019 to 22 percent in 2020.
Step 5: The Conclusion
To finish your essay, provide a concise summary that reinforces the main message of the charts.
Example Conclusion
> In conclusion, it can be stated that online sales for each of the four sectors changed drastically from 2019 to 2020. While the figures for home and kitchen and clothing fell, the numbers for the other two sectors rose during this period.
Key Takeaways for IELTS Writing Task 1
1. Always Paraphrase
Replace repeated nouns with smart synonyms.
Example:
Online sales → Internet sales
2. Focus on Trends
Group similar trends together.
Example:
- Rising sectors → Groceries & Electronics
- Falling sectors → Clothing & Home/Kitchen
3. Use Accurate Data
Always double-check percentages and ensure they match the charts exactly.
4. Link Your Ideas
Use transition words to improve flow:
- Overall
- Similarly
- In contrast
- While
- However
Happy practicing, and good luck with your upcoming IELTS mock tests on MockTestForIELTS!